While surfing the Internet Internet browser Explorer may give you messages indicating that the page contains errors and may not display correctly. Let's look at several ways to fix this problem.
Sponsored by P&G Articles on the topic "How to fix an error on a page" How to install software default internet explorer How to install new Internet Explorer How to clear cache in Explorer
Instructions
If there are no visible difficulties in the operation of the browser other than an error that appears periodically, you can try disabling script debugging so that the message no longer appears (if the error appears on more than one site at once, proceed to the next step). From the Tools menu, open Internet Options, select the Advanced tab, and check the “Disable script debugging” checkbox. If you want to turn off notification for all errors, uncheck the "Show notification for every script error" checkbox.
Try opening the site that is causing the error when viewing it from another account or from another computer to find out if the problem is local. If the error appears, it is most likely caused by incorrect web page code. In this case, you can disable script debugging by following the instructions in the previous step. If the problem goes away when you browse the site using a different computer or account, continue to the next step.
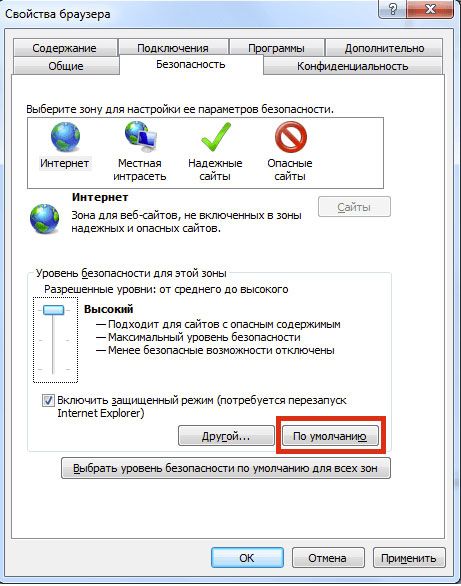
Internet Explorer may not be blocking the active scripts, Java, and ActiveX that control how information is displayed on the page when you view pages. To fix the problem, you need to reset your browser security settings. To do this, in the “Tools” menu, select “Internet Options” and go to the “Security” tab. Click the "Default" button and then "OK." If after re-running the page where the error occurred the problem remains, try the next method.
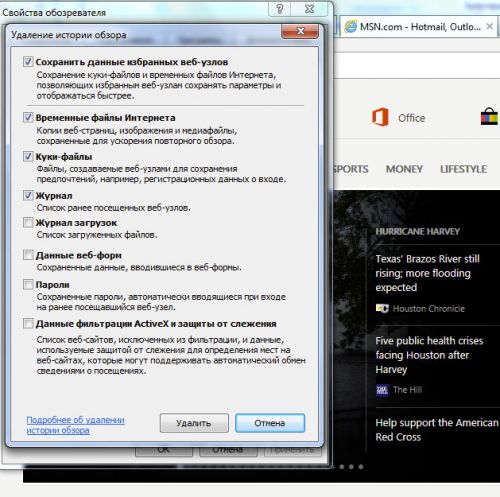
As you know, the browser stores temporary files and copies of pages in separate folder, for subsequent reference to them. If the folder size becomes too large, some pages may not display correctly. The problem can be solved by periodically emptying the folder with temporary files. To do this, open the Internet Options dialog box from the Tools menu. On the General tab, in the History group, click the Delete button. Check the boxes for Temporary Internet Files, Cookies, Log, and Web Form Data and click OK.
How simpleOther news on the topic:
Detailed instructions how to clear cookies in the most popular Internet browsers. Internet Explorer 7: 1 Click the Tools menu in your browser. 2. Select "Internet Options". 3. Under the "Log" section, click the "Delete" button. 4. Select the option to delete cookies. Internet
I need to turn it on, but I don’t understand how to do it! It seems like you need to enable it in your browser. Enable javascript in Internet Explorer 6 or 7: 1. Open the Tools menu. 2. Select Internet Options. 3. Go to the Security tab. 4. Click the Other... button 5. Scroll down to the section
Clearing your browser's search history and cache serves the purpose of speeding up your work by getting rid of unnecessary information that accumulates in the browser's memory. Another reason may be the desire to destroy traces of your presence on certain Internet pages. You will need - Internet Explorer; -
If you see the message “This page contains errors and may not display or function correctly” or “Completed, but there are errors on the page,” this may indicate that you need to troubleshoot script errors in your Internet browser operating system Microsoft Windows. Sponsor
Temporary internet files is a folder with temporary files created while browsing web pages in Internet program Explorer. These files, if not periodically deleted, can take up significant space on your hard drive. The procedure for deleting temporary Internet files depends on what
When working on the Internet, the Internet browser's cache inevitably becomes full of unnecessary information saved while visiting websites, and this information sooner or later needs to be deleted, since it takes up a lot of space on the hard drive and sometimes gets in the way. correct operation browser. Sponsor
Cookies are small packets of text data sent by a website to your computer. This information, which stores a "user code", allows the requested page to make decisions regarding whether to grant access to the site's content. Long-term cookies are cookies.txt file,
There are, of course, others - I will definitely mention them.
Firebug for Firefox
I don't know for sure whether it is FireBug The ancestor of other developer tools, but it is definitely the most popular, convenient and functional in .
Firebug is an add-on for Firefox, which means you need to download it from the Firefox add-ons website and install it.
To trigger a firebug, just press F12.
Features of this add-on:
- Inspecting and editing dynamically changing HTML;
- On-the-fly CSS editing;
- Debugging JavaScript, command line for executing scripts;
- Monitoring network requests - you can see the sizes and download times of files and scripts, request headers;
- DOM parser.
We can talk for a long time about these possibilities in detail, but I think that all our readers know them, and if not - detailed information is on Firebug's home page or the same thing in Ilya Kantor's translation.
In addition to the firebug itself, you may need a useful add-on to it - FireCookie, with which (surprise:-) you can view and change cookies.
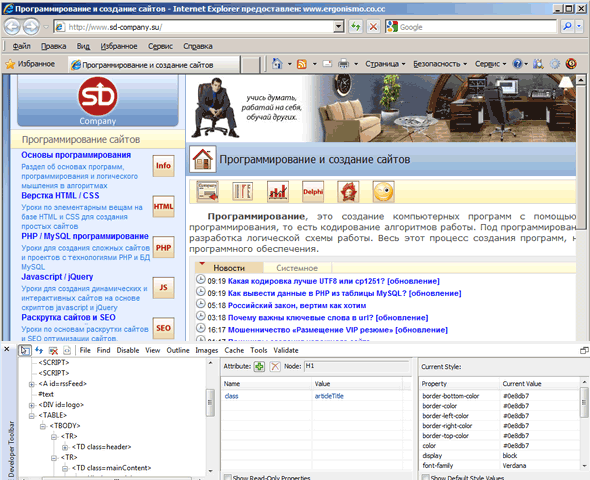
WEB Developer Toolbar for Firefox
Another useful addition to Ognelis. It looks like this:
Let's look at it point by point.
Disable
Allows you to turn off JavaScript and disable the use of the cache, which is very useful during development (allows you to be sure that the page loaded along with latest updates), cancel the colors used on the page and replace them with standard ones, prohibit sending in the referrer header (the page from which the referral was made).
Cookies
A useful option for working with cookies: you can view, delete, deny and add them.
CSS
This menu stores the coolest feature of the Developer Toolbar - editing CSS on the fly. In addition, it is possible to view css, disable, and so on and so forth. In my opinion, it is very useful to have shortcut keys(CTRL+SHIFT+C, for example, allows you to go directly to the page styles view)
Forms
Everything for working with forms: show passwords, show information about forms, convert form methods (GET » POST and vice versa) and much more. A useful function is “Populate Form Fields” for automatically filling out form fields (for example, when testing a site, when the function of remembering passwords is disabled. Otherwise, I don’t see anything useful in this item.
Images
There is a useful feature to disable images - to see what your site looks like without images. You can circle pictures, show their sizes, and show alt attributes.
Information
There are a lot of options in this menu. The function of displaying the class and id attributes on the page may be useful. In addition, the “View Color Information” item is interesting - to quickly obtain information about the colors that are used on the page. “View document size” - view the page size. “View Response Headers” - view page headers.
Miscellaneous
The most frequently used function is clearing the cache. In addition, the following functions are available: “Page ruler” - a ruler, “Page Magnifier” - a magnifying glass and “Line guides” - several lines that can be useful for trimming a template.
Outline
Highlighting different page elements - tables, headings, links, frames, blocks. Resize allows you to resize the browser window to fit any standard screen extensions. Tools features for page validation are stored here. Both local and external. Convenient and quick access to validation of HTML, CSS, and more. To validate HTML, you can use the keyboard shortcut CTRL+SHIFT+H.
View Source
View source code. Possibility of viewing in external application, viewing the generated code.
I like the one in the right corner the most. It is a fast HTML, CSS validator and JavaScript error indicator. If there are no problems, the icon is green, and if there are problems, the icon is red.
Internet Explorer Developer Toolbar
Starting from 8.0, error debug is already built into this browser. It can be easily called F12 key. True, it’s as poor as a program from the 90s.
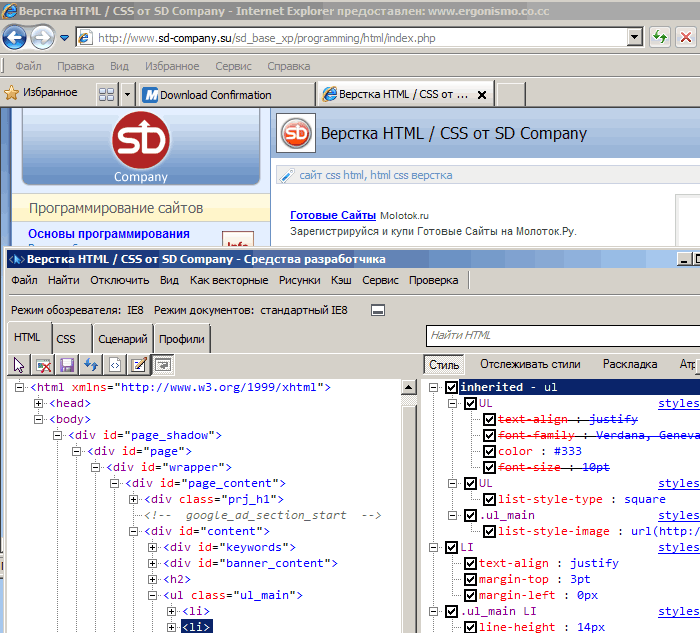
But there is a much cooler tool for this browser, the so-called Internet Explorer Developer Toolbar, which can be downloaded from the link.
In appearance, this toolbar, of course, looks like firebug, but, alas, it has not yet matured to it. Although, on the other hand, it has some features that firebug does not have. I would call Internet Explorer Developer Toolbar a kind of hybrid of Firebug and FireFox WEB Developer Toolbar.
As in firebug, it is possible to inspect an element with a simple click. But, if in we can immediately see padding and margins, here there is no such opportunity.
Additionally, Internet Explorer Developer Toolbar does not dynamically update the element tree like Firebug does. That is, if we change anything on the page using js, we won’t see anything using this toolbar.
What you can enjoy is changing CSS on the fly (an easy way to find what to hack :), the ability to disable CSS and images, the ability to quickly clear the cache and play with cookies, quick access to validation.
The best part: there is a built-in color picker, which allows you to get any color from the page using a pipette. (there is a separate ColorZilla plugin for ff).
Debug DebugBar for Internet Explorer
DebugBar for Internet Explorer can be downloaded from the given link.
An interesting extension in its own right. Installed as an additional panel to the browser:
For some reason there is a built-in search engine, an eyedropper, the ability to change the size of the window and, again, for some reason the ability to send a page to a friend for soap. Although this may be useful. But I failed to take advantage of this opportunity.
In addition, there is an inspector:
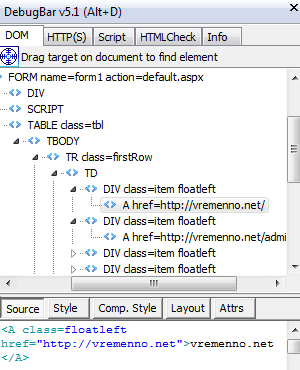
The developers were not satisfied with the method of inspection by clicking or pointing: they came up with a more interesting thing. In DebugBar you need to drag the crosshair onto the desired element to see it in the tree. There is no ability to edit CSS. But there is a validator and a built-in js console.
And if you dig into the settings you can find this:
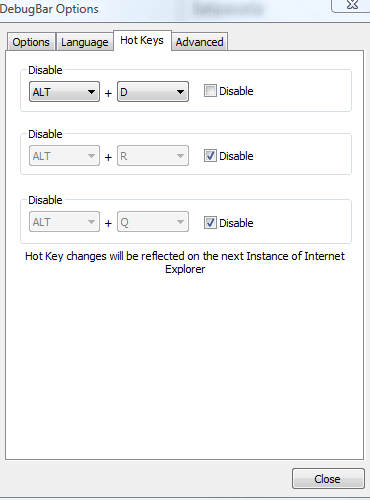
Both funny and sad.
It is known that the Developer Toolbar will be built into the eighth explorer. It will be similar to the one described in the third paragraph, but we hope that it will be better.
Debug DragonFly for Opera
![]()
DragonFly is built into Opera starting from version 9.5, so there is no need to install it. In order to activate Dragonfly, go to Tools → Advanced → Developer Tools. And if in English, then Tools → Advanced → Developer Tools.
I’ll warn you right away that DragonFly is in the Alpha2 stage, this explains many of its glitches.
Features list:
- DOM inspector;
- Inspect by click (again, we won't see indentation like in FireFox);
- Editing ;
- Quick access to the error console.
DF is something like a separate page in a frame. If you open it, it will be open for all tabs (unlike firebug). Therefore, before inspecting an element, we must select from the list the page that we want to view.
Unfortunately, here, as in Internet Explorer Dav Toolbar, dynamically created elements are not displayed. And in general, when we inspect the page, no JavaScript is launched: links and buttons are not clicked. Let's hope we see all of these features when DragonFly gets closer to release.
Debug WEB Inspector in Safari
I’ll say right away that it’s about the browser Safari I missed the information, so I am not responsible for the adequacy of the material, as they say.
![]()
In order to enable the “Development” item in the Safari menu, you need to enable the corresponding item in the settings (the “Advanced” tab):
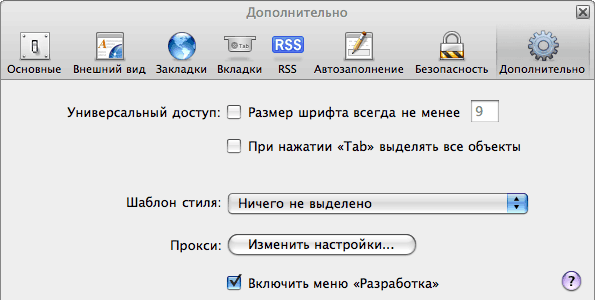
In the “Development” menu the following functions are available to us:
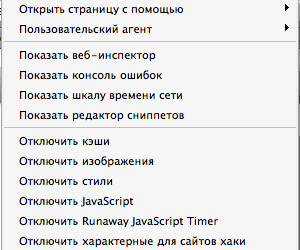
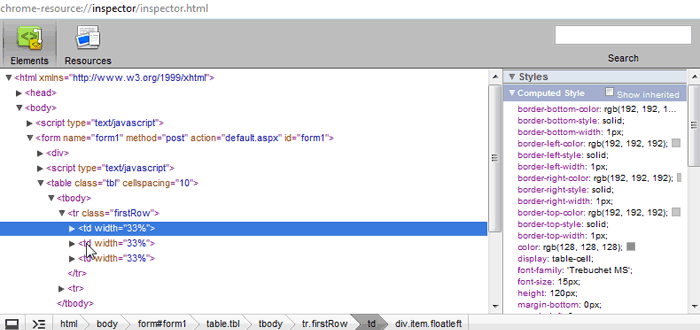
Let's take a closer look at the WEB inspector:
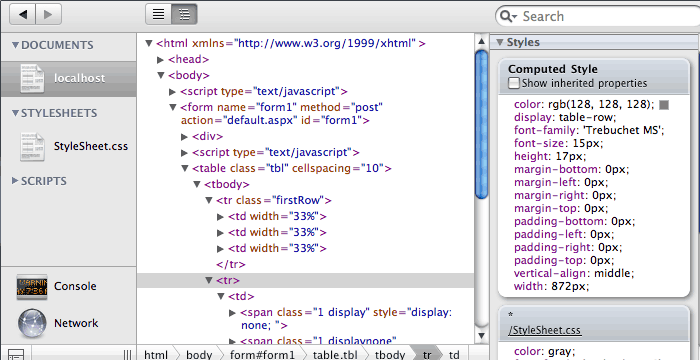
By default, the inspector opens in HTML view mode. But it can be switched to DOM view mode. For this purpose, there is a switch on the top plate. When you hover over an element in the inspector, it will be highlighted on the page itself. You can't see padding, change markup or CSS on the fly, or see dynamic changes in DOMe on the fly like you can in FireBug. But, you must admit, it looks very cute.
If you want to work with the inspector in a browser window, you can click on the button in the lower left corner.
Even in Safari, a function such as “Network Timeline” is available (the “Network” button in the inspector):
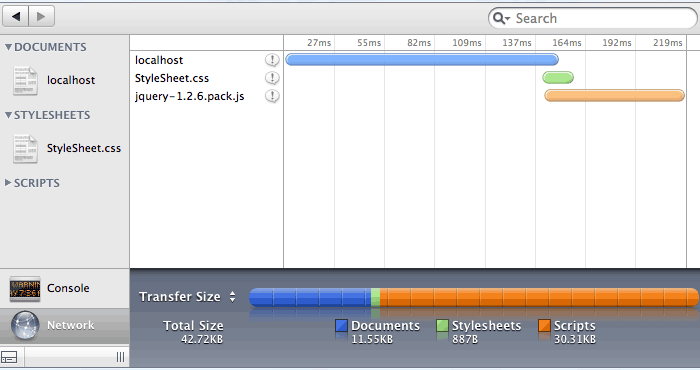
You can clearly see when and how long it takes to download files. You can also view request headers, but, unfortunately, you cannot view the content itself.
Debug for developers in Google Chrome
Lame was born in an advanced form, and it immediately has, albeit crooked for now, but still tools for developers.
- DOM Inspector;
- javascript debugger;
- JavaScript Console.
In order to inspect any element, you need to click on it right click and in context menu select “View element code”:
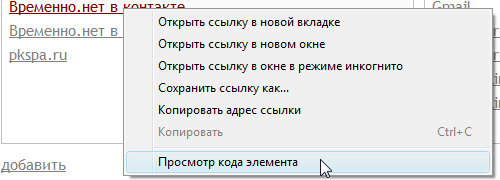
The functionality is the same as in Safari: elements are highlighted when hovered, but CSS and HTML editing is not available, and changes in the DOM are not tracked. But the button in the lower left corner, which should attach the inspector to the browser window, does not work.
In the “Resources” tab we can see the following:
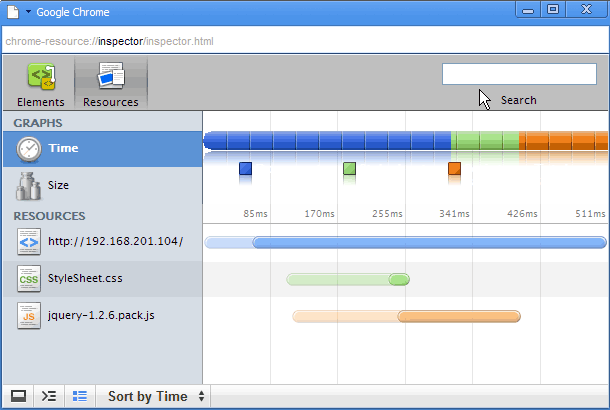
Slightly different from the scale in safari. Translucent in this diagram shows the relative file sizes, and full color shows the loading time. One way or another, it is obvious that this part of Chrome is far from finished.
In this article, I looked at the most famous browser extensions and built-ins.
There are others, for example:
- Internet Explorer WEB Development Helper - a good assistant for ASP.NET developers (Internet Explorer);
- WEB Developer Toolbar - toolbar for Internet Explorer and FireFox. There are a few useful functions;
- WEB Accessibility Toolbar - toolbar for Internet Explorer. Nothing interesting.
If there are add-ons that I didn’t mention, but they should, or there are functions for the mentioned extensions that I missed, please write.
Enjoy it for your health!
Sometimes the browser may notify the user that a script error has occurred. This also applies to standard Internet Explorer. In it, by the way, such a failure occurs more often than in other browsers. What could be causing this problem and how to solve it?
A script error usually occurs when the browser is unable to correctly parse the HTML codes on the page. Also, a download failure can be caused by an excessive number of temporary files (especially if the browser has not been cleaned of them for a long time). Also, some account settings may prevent the resource from launching correctly. Today we will look at how to remove a script error in Internet Explorer, taking into account all these reasons.
First actions
If this happens for the first time, it may be an isolated incident. Therefore, there is nothing to worry about. Try reloading the page. If the notification appears again asking if you should stop running this script, click the No button.
We determined that this was not an isolated incident. What to do next? See if it gives an error when opening all pages or just one. If on one, then log into another account on the same site, open the page in another browser and PC.
You can use another browser. Today there are a lot of them, but they are in no way inferior to a standard instrument, and even superior in many things. If you have all your bookmarks saved in IE, you can use the data export function.
Blocking active ActiveX and Java scripts
Have you decided not to switch to another program? In this case, we will solve the problem further.
Active X and Java may be disabled or blocked. This is one of the common causes of scripting errors. What to do in this case? You need to reset your browser security settings.
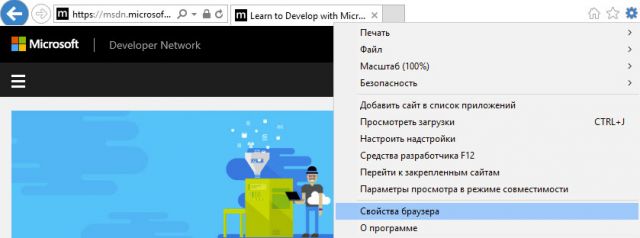
Launch the program. Click on the gear icon. She will be next to the star. In the list of options that appears, select the “Browser Options” section. This will be the penultimate point.
Open the second tab “Security”. Click on the “Default” button. Click on OK.
Temporary files in the browser
Internet Explorer saves versions of pages when they are launched. All copies are stored in a folder with temporary files. This folder needs to be cleaned from time to time. If the folder reaches, for example, several gigabytes in size, the browser will begin to freeze and display, in particular, a script error. In this case, you need to delete all the contents of the specified storage.
The following method will help you get rid of garbage in your cache, browsing history, cookies, web form data, and passwords. You, of course, have the right to choose which type of files to delete and which to leave.
- Again, click on the gear that is already familiar to us. Select “Internet Options”.
- Switch to the "General" section.
- In the “Browser History” block, confidently click on the “Delete” button.
- Check the box next to temporary files and other types of files you want to get rid of, and then confirm the deletion.
Antivirus blocking
Scripts may not be executed because your antivirus software is blocking them or scanning folders with temporary files. What do we have to do? Open an antivirus window and disable blocking of interactive elements. There is no single disabling instruction for all antiviruses. The procedure will differ depending on the type of antivirus you have.
Incorrect processing of HTML page code
This situation usually occurs when only one site freezes. This means that the page code is not suitable for Internet Explorer. For the page to load, script debugging must be disabled.
- Go back to the “Internet Options” window.
- This time go to the fourth block “Advanced”.
- Uncheck the "Show notification for every script error" checkbox. Save your changes.
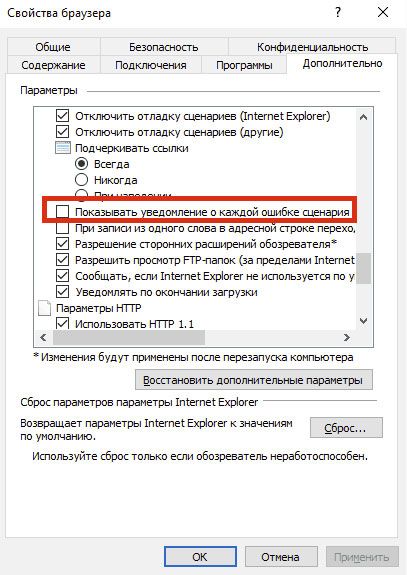
If the user has disabled script debugging, the error notification no longer appears. The page will freeze anyway, so this method can only be used if there are problems with only one site.
Download available updates
The script may also not execute correctly due to the fact that the necessary updates for the system itself and Internet Explorer are missing. An update can completely solve the problem.
Go to the Update Center on your PC and make sure that all updates are installed. If not, then run the installation.
Using the system registry
The failure may appear when loading the Windows OS, that is, when starting the computer. This is far from a serious failure, but the situation still needs to be corrected. The system registry will be used. The method for fixing the error is much more complicated than the previous ones. If you are a beginner, ask a more knowledgeable user to do this for you.
1. Launch the “Run” window and enter the regedit command in the line.
2. Right-click on the HKEY_LOCAL_MACHINE block and select “Permissions”.
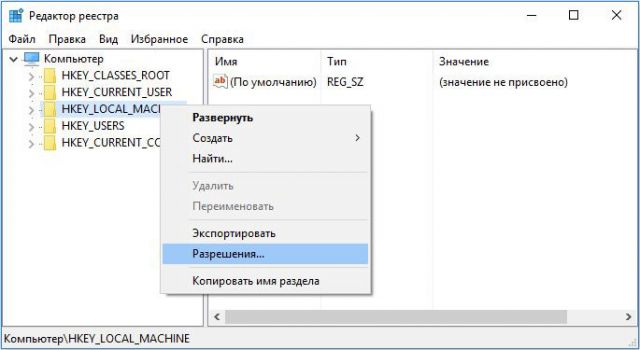
3.In the window that appears below, set full access and read.
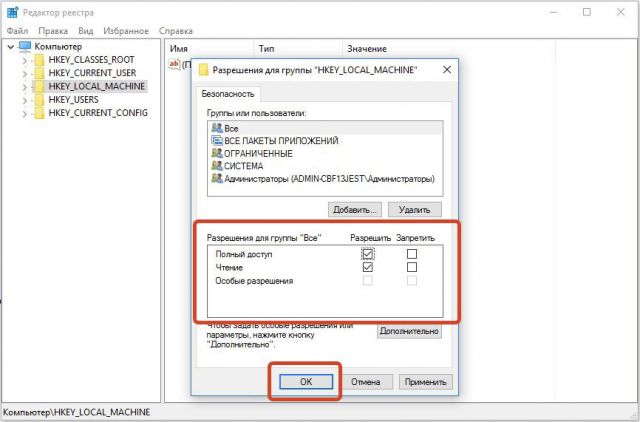
4.Open Additional options. Click on the “Change” button and set “Allow”
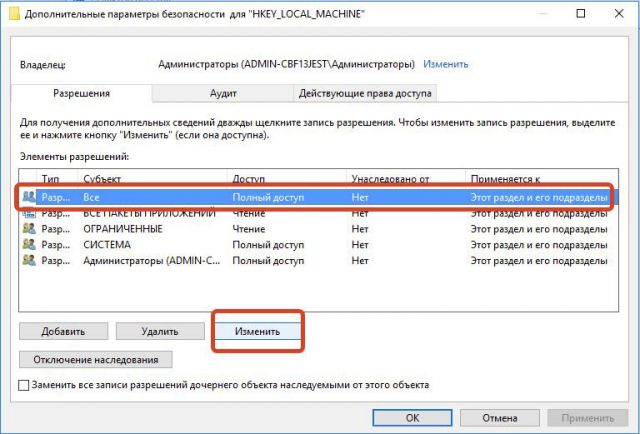
5. Confirm saving the settings. Click on OK.
6.Reboot your device. Call command line. The final touch is the following command: regsvr32 msxml.dll. Press Enter on your keyboard.
Script error in Internet Explorer can be solved in many ways. We presented both simple and complex ones. The choice of method depends on the cause, and since it is not so easy to determine, use method after method.