Almost all people perceive information better “drawn” than “heard”. And it’s even better if this information is presented in images, rather than a series of numbers and indicators. Imagine that a stranger is talking about his dog. He does not describe her appearance and pedigree, does not specify color and age, etc. The imagination of each listener will draw its own image. And when we already imagine a handsome Great Dane, it turns out that we were told about a lovely pug. In this situation, we will laugh, but when faced with something similar at the enterprise, it will no longer be a laughing matter.
Therefore, in production everyone tries to visualize as much as possible. One of the most important documents, especially in construction, is the work schedule. We can safely say that the entire project without this schedule is wasted time. Since it contains all the adopted engineering and technical decisions, and also optimizes the timing.
What is a calendar plan?
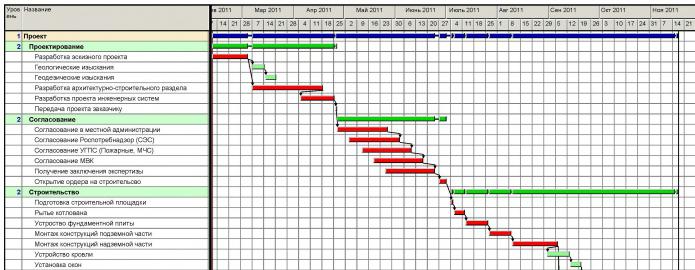
The very name of this document gives an idea of its importance and significance. Calendar schedule production of works is a table that displays all their volume and deadlines for completion. In addition, the graph clearly shows the sequence of work performed, tied to specific dates (or simply the duration of various types of work - for typical projects). Most often, this document also contains information about the resources needed at each stage of construction: basic materials, equipment and personnel.
The ability to draw up a work schedule is one of the most important skills for managers at various levels. The more accurate and detailed the schedule is, the better all planned work will be carried out. Despite the fact that construction is considered the “native” branch of the work schedule, it would not hurt managers of all areas to know the principles
Where to begin
Any job can be broken down into small tasks. The simplest example is preparing a salad from fresh vegetables. What would seem simpler? But this elementary task can be divided into a sequence of actions. First, purchase all the ingredients, then wash them, cut them and mix them, seasoning them with sauce. Moreover, all actions can be separated in time (breaks in work appear), or they can be done sequentially, without breaks in time. In addition, all this can be done by one person, or maybe a whole team of cooks. So, there is a sequence of actions. It remains to calculate the completion time of each stage and determine how many and what kind of personnel are needed for this work. And our work schedule is almost ready.
Regardless of the industry, when planning, you first need to highlight the scope of work: break the entire process into components. Moreover, the criteria can be not only technological differences, but also the number of workers, and the necessary mechanisms and devices, etc.
Deadlines
After dividing everything into a sequence of actions, you can begin to calculate the deadlines for completing the work. For production and construction, there are regulations and standards by which specific deadlines are calculated for a given amount of work. For mental work, it is impossible to calculate the deadlines for completing work using a formula. But a manager with extensive experience, who has information about his staff, can quite clearly set a time frame for solving the task.
Knowing the deadlines for completing each type of work, we can begin to determine the time required to complete the entire process. It should be remembered that some tasks can be solved in parallel, and certain processes require technological breaks. 
Resource calculation
Of course, the staff essential element process. The construction work schedule involves determining the number of performers, the specialization of workers and their qualifications. At this stage, we calculate the number and composition of teams and draw up a calendar plan for their employment at the site.
Next we move on to the definition necessary equipment, mechanisms and devices. There are also regulations for this in manufacturing industries. And finally, last but not least important is the calculation of the materials required for the work.
Calculation of delivery times for materials
All this information will allow you to combine the work schedule with the delivery schedule of materials and equipment. Uniformity and continuity are the two basic principles of planning. Optimizing the schedule in the direction of reducing deadlines may not give the desired result, because there will be downtime in the work due to a lack of materials (or, conversely, the construction site will be literally clogged with them, and therefore it will take a lot of time to find what is needed at the moment).

Force majeure increases the deadlines for completing work
Another important detail is that when drawing up a work plan, it is necessary to provide for possible risks. For construction, this could be anything from bad weather to heavy traffic on the roads. Taking into account force majeure circumstances, it is necessary to slightly increase the deadlines for completing certain types of work. Most often, this also affects the duration of the entire volume.
Despite this, planners should not strive to minimize time. After all, when work is disrupted, the general contractor will have to pay a penalty to both the customer and related contractors.
Automation of plotting
Just a few years ago, the calendar plan was compiled manually. The specialists calculated all the deadlines and the need for personnel and materials, and then visualized it with the help. For small volumes work, this is not a difficult task. It’s a different matter if we are talking about a serious contracting organization managing several projects at the same time.
Programmers develop many auxiliary programs designed to automatically calculate and build a work schedule. Sample calendar plan, calculated using Microsoft Office Project 2010 Professional, for example, is easily found on the Internet. However, not every company will agree to spend additional funds on installation software and training staff to work with it. In addition, each specialized program has its own disadvantages. One does not take into account the possibility of shift work, the other, without writing macros, does not agree with the calculation of materials, for example, etc.
Therefore, most specialists involved in planning have learned to build a work schedule in Excel.
This program has many advantages:
- It's free. In the sense that Excel is part of the standard MS Office package, which is unconditionally installed on almost every computer.
- It's simple. Having minimal knowledge about calculating formulas and linking sheets to each other, you can do planning.
- It's visual. All calculations and results are displayed on one sheet. And making changes is immediately displayed on the graph.
Method 1. Fast - use conditional formatting
Using conditional formatting, we can force Excel to fill a cell with any selected color if its date falls between the start and end of the stage. The easiest way to do this is to use a logical function AND , which in this case checks whether both conditions are met (January 5th is later than the 4th and earlier than the 8th):
An example of such a diagram can be taken
Method 2. Long, but familiar - use a diagram
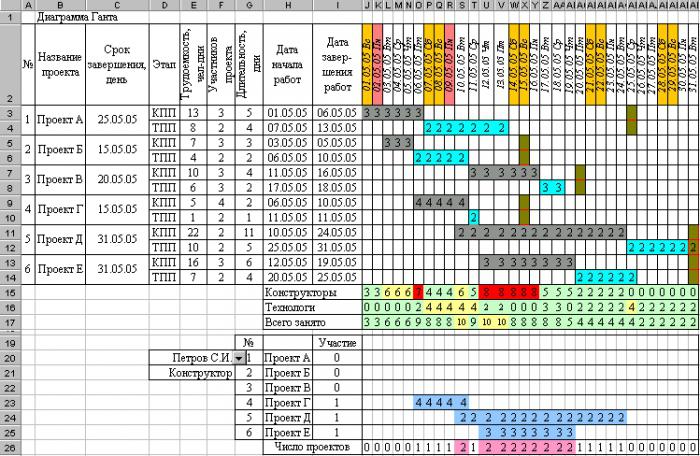
So, we have a table listing the stages of the project, the start and end dates and the duration of each stage:
The task is to build standard means calendar chart, as in the picture:

Let's go, step by step:
Let's select the source data for the chart - range A2:B13 and select from the menuInsert - Diagram, type - Linear with accumulation:
On the Row tab, click the Add button , place the cursor in the field Values and select cells with stage durations ( C2:C13 ):
Click the Next button and in the third step of the Wizard on the tab Legend uncheck Add legend. That's it - click Finish . It should look something like this:
Don’t be alarmed - everything is going according to plan - you just need to “bring it to mind” our diagram. To do this, click right click mouse along the vertical axis with the names of the stages and select in the context menu Axis format:
On the Scale tab in the window that opens, put two checkboxes -Reverse category order And Y-intercept in maximum category. Click OK. Now let's get rid of the blue columns. Double-click on any of them and in the window that opens, select an invisible frame and a transparent fill. It should look like this:
Already seems like the truth, right? All that remains is to correctly configure the range of data displayed on the chart. To do this, you need to find out the real contents of the cells from which the timeline begins and ends (yellow and green cells in the table). The fact is that Excel only displays a date in a cell as day-month-year, but in fact stores any date in a cell as the number of days that have passed from 1/1/1900 to the current date. Select the yellow and green cells and try to set the General format for them one by one (menu Format - Cells). The result will be 38350 and 38427, respectively. Let's add three more days to the end date - we get 38340. Remember these numbers.
All that remains is to right-click on the horizontal time axis and select Axis format and enter these numbers into the tab Scale:

After clicking OK the diagram will take the required form:

All that’s left to do is to “bring the shine” - adjust the colors, fonts, axis labels, etc. - I think you can handle this without my advice... :)
FORUM NEWS  Knights of Aether Theory | 11/18/2017 - 23:27: -> - Karim_Khaidarov. 10/19/2017 - 04:24: -> - Karim_Khaidarov. 10/11/2017 - 05:10: -> - Karim_Khaidarov. 10/05/2017 - 11:03: -> - Karim_Khaidarov. 04.10.2017 - 15:26: |
Attending Gleb Arkhangelsky’s two-day “Time Management” training, which he conducted at Wimm-Bill-Dann, made a strong impression on me.
Its main result is a new impulse of interest in the relevant issue. This was my third training on this topic with different presenters, but it differed favorably from the others both in its conceptual approach and liveliness of presentation, as well as in its practical value. Perhaps one of the main practical acquisitions was the method I developed for daily planning of working time in the environment Microsoft Excel
, using several ideas gleaned from the workshop. It was a big step forward in the organization of work compared to the old method of planning in a regular diary in terms of convenience, time saving and manufacturability. I will outline this method below. It allows you to simultaneously plan both your tasks and the tasks of your subordinates. So in this case, a file with a work plan for the day can be posted, say, in so that all employees can see it.
I would like to note right away that, in my opinion, this technique of operational planning makes practical sense in the case when every day you have to deal with at least 4 5 different tasks. If this is not the case, then for operational planning the same diary or any analogue would be more appropriate.
To begin with, I will briefly describe the ideas received during the training on which the method is based.
1. Planning tasks according to the “day week month (year)” scheme.
- In my opinion, this is a very flexible and successful planning technique. From the point of view of practical application, perhaps my most valuable acquisition at the seminar.
- Its main idea is that all tasks are divided into three types (or statuses):
- tasks that need to be solved today
tasks that you plan to start tackling over the next week,
tasks that will need to be addressed in the longer term.
The first and second lists are reviewed and updated at the beginning of each working day (or at the end of the previous one), the third weekly.
2. Time budgeting, dividing daily tasks into rigid (tied to a specific time), flexible (which can be completed during the day) and budgeted (flexible tasks with a certain amount of time allocated to them).
- 3. Contextual planning, the use of kairos randomly arising moments that are favorable for solving certain problems.
- Description of the planning methodology
- All newly emerging tasks are recorded in the general list as they appear.
In this case, in addition to the task itself, its status is indicated (day, week or month-year), as well as, if necessary, the employee responsible for the implementation, the date to which the task is scheduled, the time, the expected day of completion of the task (usually for projects), Kairos.
Every day at the end of the working day, the next working day is planned based on this general list. A list of tasks for the day is compiled, breaking them down into rigid, flexible and budgeted ones; if necessary, the employees responsible for execution, time, and other notes are indicated.
During the day, the work plan is in front of your eyes, it is adjusted: making notes on execution and new urgent tasks.
1. On the sheet “1 7 31” there is a general list of emerging tasks. Description of fields (required fields are marked with an asterisk):
No..* serial number of the task in the list
TASK * the task itself
DATE date of task update, i.e. on what day should it be completed or started?
TIME time of updating the task (start of a meeting, etc.)
DEADLINE * job status. It has 4 possible values, selectable from the list: “day”, “week”, “month year”, “completed”. To improve visualization, each value is automatically colored using conditional formatting.
ESTIMATED COMPLETION and
REAL COMPLETION these two fields can be useful for evaluating the performance of employees performing a taskKAIROS field for contextual planning; example “boss”, i.e. This sign will indicate issues that need to be resolved during an unscheduled meeting with management.
If specific work is required, other fields can be added to the sheet. For example, CONTACT PERSON a person from a related department with whom you need to interact on this issue, NOTE, etc.
Changes made on the sheet “1 7 31” can be of two types.
First adding new tasks to the list and changing existing ones. These additions are made to the sheet “on line” as they appear.
The second type of changes is analysis and adjustment of task statuses. As mentioned above, the analysis of tasks with the status “day” and “week” occurs every day at the end of the working day or the beginning of a new one. Analysis of tasks with the status “month year” occurs weekly. In this case, if necessary, the status of tasks changes to one of the other three possible types. To select a list of tasks with a given status, it is convenient to use an autofilter. For example, at the end of the working day, all tasks with the status “day” are selected in this way, then the list is viewed, if the task is still relevant for execution the next day, then the status does not change; if the task is completed, the status changes to “completed”; When the urgency level decreases, the task status changes to “week” or “month year”. Now, if, after completing the daily task analysis, you select tasks with the “day” status using the autofilter, you will get a list of tasks to be completed on the next working day, which is copied to the “by day” sheet.
2. The “by day” sheet is used to plan tasks for each day.
Field descriptions:
DONE sign of completion; white background not done, black background done, gray background not done and will not be done that day (lack of time, transfer to another day, task cancelled). The field is filled in throughout the day as the situation changes
No. serial number of the task
RESPONSIBLE name of the employee responsible for the execution of the task
FLEXIBLE list of flexible tasks
HARD list of hard tasks
TIME start time for hard tasks
If specific work is required, other fields can be added to the sheet. For example, BUDGETED a list of budgeted tasks plus another field for the time allocated for them, or this time can be indicated in the TIME field, NOTE, etc.
As mentioned above, the list of tasks for the day is obtained as a result of daily analysis of the general list of tasks for their status. After adjusting the statuses on the sheet “1 7 31”, using an autofilter, tasks with the status “day” are selected and copied to the sheet “by day” for the corresponding date under the tasks of the previous day. Two columns are copied: OWNER and TASK. Further, for convenience, the lines related to the previous day are hidden.
After copying, all tasks fall into the FLEXIBLE column; accordingly, rigid and budgeted tasks must be manually transferred to the appropriate columns and filling in the TIME field.
After this, the work plan for the current day is almost ready on the “by day” sheet.
- For better visualization, I also apply the following cell background color formatting:
- I highlight the names of the performers in green
- yellow the most important tasks that you need to pay attention to
- pink urgent tasks for which you need to report to management
blue auxiliary questions not directly related to the work process.
To sum up the above, I would like to say that the fact of the appearance of the described technique became for me a worthy result of visiting G. Arkhangelsky’s seminar.
Sergey Olekhov,
Head of Analytical Service
Lianozovsky Dairy Plant 04/25/06
Sergey Olekhov, April 2006 Editing Gleb Arkhangelsky,
The article was written specifically for the site. Document address on the website: